7. Use Case: Brightness Temperature Distance Map Verification
If you would like to follow along with the exercises in this video, please select one of the options to set up your own Training Environment.
My name is Christina Kalb, and I’m a scientist working on the METplus team at NCAR. This video will cover how to run the Brightness Temperature Distance Map Use Case. Specific information about this Use Case can be found in the METplus User’s Guide (Click on User’s Guide). Go to Section 5, METplus Use Cases, Model Applications, Convection Allowing Models and click on Grid-Stat: Brightness Temperature Distance Maps.
Looking at the information, we see that this Use Case runs Grid-Stat to create distance maps on the FV3 Model ensemble members compared to GOES brightness temperature data (Scroll down to METplus Workflow). It is set up to run two ensemble members, onemodel initialization time, and two forecast lead times. The METplus and MET configuration files are shown here in the documentation.
If you want to learn more about Grid-Stat and distance maps go to the Met Users Guide under Section 10 which is on the Grid-Stat tool. This video assumes that you have already installed MET and set up your environment for METplus. Information on how to do this can be found in Section 1 and the Installation and Setup sections of the online tutorial topics. Here we will be using the recommended setup, which is first passing in a Use Case specific to the configuration file, followed by a second configuration file with settings that are specific to the system we are using.
So let’s go ahead and take a look at the parameter file and the settings for this Use Case. We’ll first go into the METplus Repository.
cd METplus
ls
Tutorial_system.conf is the system specific configuration file. The use case specific configuration file is located under: parm/use_cases/model_applications/convection_allowing_models and it’s called: GridStat_fcstFV3_obsGOES_BrightnessTempDmap.conf
So we will go ahead and open this file.
vim parm/use_cases/model_applications/convection_allowing_models/GridStat_fcstFV3_obsGOES_BrightnessTempDmap.conf
If we first look at the process list inside this file, we will see that there are two instances of Grid-Stat. These two instances are for the two ensemble members and the values in parenthesis are identifiers for the members (PROCESS_LIST = GridStat(lsm1), GridStat(mp1)).
So if we scroll down to the bottom of the file and we look at: GRID_STAT_OUTPUT_PREFIX = FV3_core {instance} and FCST_GRID_STAT_INPUT_TEMPLATE = {init?fmt=%y%m%d%h}/core_{instance}/core_{instance}_{init?fmt=%y%m%d}_{init?fmt=%h%m}_f{lead?fmt=%HH}.nc, we see the word {instance} in both of these variables. This value is set to the ensemble member in parenthesis in the process list when METplus is run and it’s how it points to the different members.
Next let’s check our paths to the input data. To do this we need to know the value of INPUT_BASE as it is given in FCST_GRID_STAT_INPUT_DIR and OBS_GRID_STAT_INPUT_DIR. So we’ll go to another terminal and pull up Tutorial_system.conf (Open new terminal window).
cd METplus
vim Tutorial_system.conf
INPUT_BASE is set to the following path that’s listed here. (INPUT_BASE = /d1/projects/METplus/METplus_Data)
So we can combine that with the rest of the FCST_GRID_STAT_INPUT_DIR (FCST_GRID_STAT_INPUT_DIR = (INPUT_BASE)/model_applications/convetion_allowing_models/brightness_temperature) to check for files.
ls CHANGE_TO_YOUR_INPUT_BASE/model_applications/convection_allowing_models/brightness_temperature
Here we see that there are two date directories and a polygon for verification. If we go back and then look at FCST_GRID_STAT_INPUT_TEMPLATE, we see that the model date is given as year, month, day, and hour, which is the first template seen here (2019052100).
Inside this directory we will see that there are four ensemble members. But only two will be run for the use case.
So let’s check the first ensemble member and see if we’ve got files.
ls CHANGE_TO_YOUR_INPUT_BASE/model_applications/convection_allowing_models/brightness_temperature/2019052100/core_lsm1
Here we see that there are two files. One for the 01 hour for the forecast lead time and another for the 02 hour forecast lead time, which is as we would expect.
So next we will go ahead and check the observed input files. OBS_GRID_STAT_INPUT_DIR is the same as FCST_GRID_STAT_INPUT_DIR, so we will copy/paste.
ls CHANGE_TO_YOUR_INPUT_BASE/model_applications/convection_allowing_models/brightness_temperature
However, in this case, the observed input template is given as year_month_day_141. So that’s the second directory listed here (2019_05_21_141). Inside this directory we see that there are two GOES files; one for the 01 UTC valid time and another for the 02 UTC valid time.
Next let’s check our input variables to be sure that we have them correctly specified in the configuration file. First looking at the model data, we will open a model file.
ncdump CHANGE_TO_YOUR_INPUT_BASE/model_applications/convection_allowing_models/brightness_temperature/2019052100/core_lsm1/core_lsm1_20190521_0000_f01.nc | more
The variable that we have specified in our configuration file is called SBTA1613_topofatmosphere and the level is set to “(*,*)” which indicates the variable is in two dimensions. If we scroll through our input file, we see that the variable name, SBTA1613_topofatmosphere(lat, lon), is listed here and it’s in two dimensions. So our model variable is specified correctly.
Next we will check the observed variable. If I scroll up so that I can get the directory as we listed previously.
ncdump CHANGE_TO_YOUR_INPUT_BASE/model_applications/convection_allowing_models/brightness_temperature/2019_05_21_141/remap_GOES-16.20190521.010000.nc | more
Looking at the configuration file. the observed variable is called channel_13_brightness_temperature and it’s also in two dimensions. Scrolling down through the file here we see channel_13_brightness_temperature(lat, lon) and it’s in two dimensions in our obs input file. Additionally, in this case we’re using a threshold of 235 Kelvin to create the distance maps (le235).
And, finally, to get distance map output from Grid-Stat we have to set the GRID_STAT_OUTPUT_FLAG_DMAP in our configuration file. It can be set to either STAT or BOTH. Here we have it sent to BOTH which will produce two output files, a .stat file and a .txt file.
GRID_STAT_OUTPUT_FLAG_DMAP = BOTH
So now we’re ready to start the Use Case. We start by calling the script, run_metplus.py, which is in the ush/ directory, followed by -c and then our Use Case specific configuration file, followed by a -c and then our tutorial or system configuration file.
ush/run_metplus.py -c parm/use_cases/model_applications/convection_allowing_models/GridStat_fcstFV3_obsGOES_BrightnessTempDmap.conf -c Tutorial_system.conf
So here the use case is running. It will go through four calls to Grid-Stat, one for each of the two forecast lead times and ensemble members. And the METplus run has now finished successfully! So let’s take a look at the output to be sure that we have what is expected. We will first go back to the Use Case documentation.
Scrolling down to the expected output, we can see that the expected output is twelve files. The first six are for the core_lsm1 ensemble member and the second six are for the core_mp1 member. Each member contains two valid times, 01 UTC and 02 UTC valid on May 21, 2019. There are three files for each Ensemble member and valid time. The files ending in dmap.txt and .stat contain the distance map output line. We have two files here because we set the dmap flag to BOTH. The file with pairs.nc at the end contains gridded output including the distance maps.
So if we go back to our METplus run, we can first take a look at the log output to find our output directory.
vim CHANGE_TO_YOUR_LOG_FILE
When we scroll down the output directory is listed here after the -outdir flag in our Grid-Stat call.
ls CHANGE_TO_YOUR_OUTPUT_BASE/convection_allowing_models/brightness_temperature/grid_stat
Looking inside this directory we see that we have all twelve expected files. Finally, we can make a distance map image by using the plot_data_plane tool in MET. So first we need to take a look at the pairs.nc file so that we can get the name of the variable we want to plot for our distance map.
ncdump CHANGE_TO_YOUR_OUTPUT_BASE/convection_allowing_models/brightness_temperature/grid_stat/grid_stat_FV3_core_lsm1_010000L_20190521_010000V_pairs.nc | more
The obs distance map variable is specified here and it’s in two dimensions. (OBS_DMAP_le235_channel_13_brightness_temperature_all_all_FULL( lat, lon)). Exiting out of this file, we can now call plot_data_plane, using plot_data_plane, and then we specify the input file name and then secondly the name of the output PostScript file we want which I’m going to call distance_map.ps. And then the variable we want to plot is specified using the following string, by calling name equals and our variable name in quotes, followed buy a semi colon, and then level equals, and in this case two asterisks in parenthesis in quotes (‘name=”OBS_DMAP_le235_channel_13_brightness_temperature_all_all_FULL; level=”(*,*)”;’).
ctrl-c
plot_data_plane CHANGE_TO_YOUR_OUTPUT_BASE/convection_allowing_models/brightness_temperature/grid_stat/grid_stat_FV3_core_lsm1_010000L_20190521_010000V_pairs.nc distance_map.ps 'name="OBS_DMAP_le235_channel_13_brightness_temperature_all_all_FULL"; level="(*,*)";'
So plot_data_plane has finished successfully. The output image looks as follows.
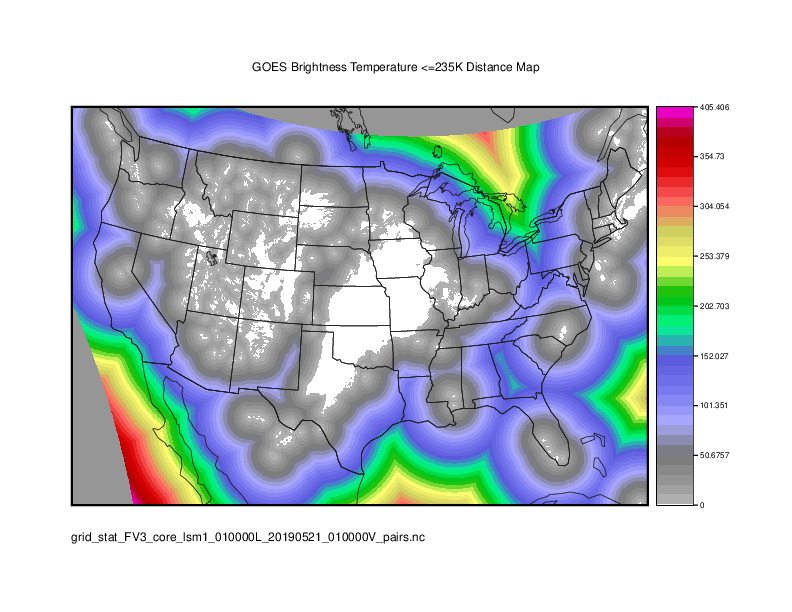
If we compare this to the distance map image in the use case documentation we will see that they match. So our METplus run has completed successfully!
This concludes the tutorial on the Brightness Temperature Distance Map Use Case. Thank you for watching.